Navigating the Tariff Storm: Data-Driven Strategies for Global Trade Resiliencere
🌐 1. The New Tariff Landscape: Heatmaps & Policy Shifts
Trump 2.0 tariffs have ignited a chain reaction:
200% duty on aluminum of undetermined origin (effective June 2025) 1
145% tariffs on Chinese goods and 50% on steel appliances, triggering Mexico/Canada retaliations 19
60+ countries now face U.S. tariffs >20%, with exemptions only for energy and U.K. metals 1
Chart Recommendation:
“2025 Global Tariff Heatmap”
Data Source: WTO Tariff Profiles (2023) 8 + CEIC tariff tracker 1
Visual: Interactive map with drill-down by country/commodity. Hover reveals bound vs. applied rates.
📉 2. Trade Flow Disruptions: Sankey Diagrams
Pre-tariff stockpiling masked underlying fragility:
Q1 2025 surge: WTO Trade Index hit 103.5 (containers: 107.1) as importers raced deadlines 9
Q2 collapse: New export orders plunged to 97.9 – lowest since 2020 9
Diverging pathways: Mexican auto exports to U.S. ↑ 18% (nearshoring), Chinese electronics ↓ 29% 1
Chart Recommendation:
“Trade Flow Sankey Diagram (2024-2025)”
Data: Oxford Economics TradePrism (46 economies, 1,200 products) 4
Visual: Animated flow lines showing export redirection from China → Mexico/Vietnam.
⚖️ 3. Sectoral Impact Radar Charts
Material costs are decimating margins:
| Sector | Cost Surge (Feb-May 2025) | Primary Trigger |
|---|---|---|
| Industrial Packaging | Aluminum ↑ 139% | “Originless metal” tariffs |
| Automotive | Steel ↑ 77% | Reciprocal auto duties |
| Electronics | Rare earths ↑ 210% | Green tech subsidies |
Chart Recommendation:
“Cost Inflation Radar”
Axes: Metals, plastics, bio-materials, logistics, labor
Outliers: Bio-packaging firms (NEXE) show 12% cost reduction
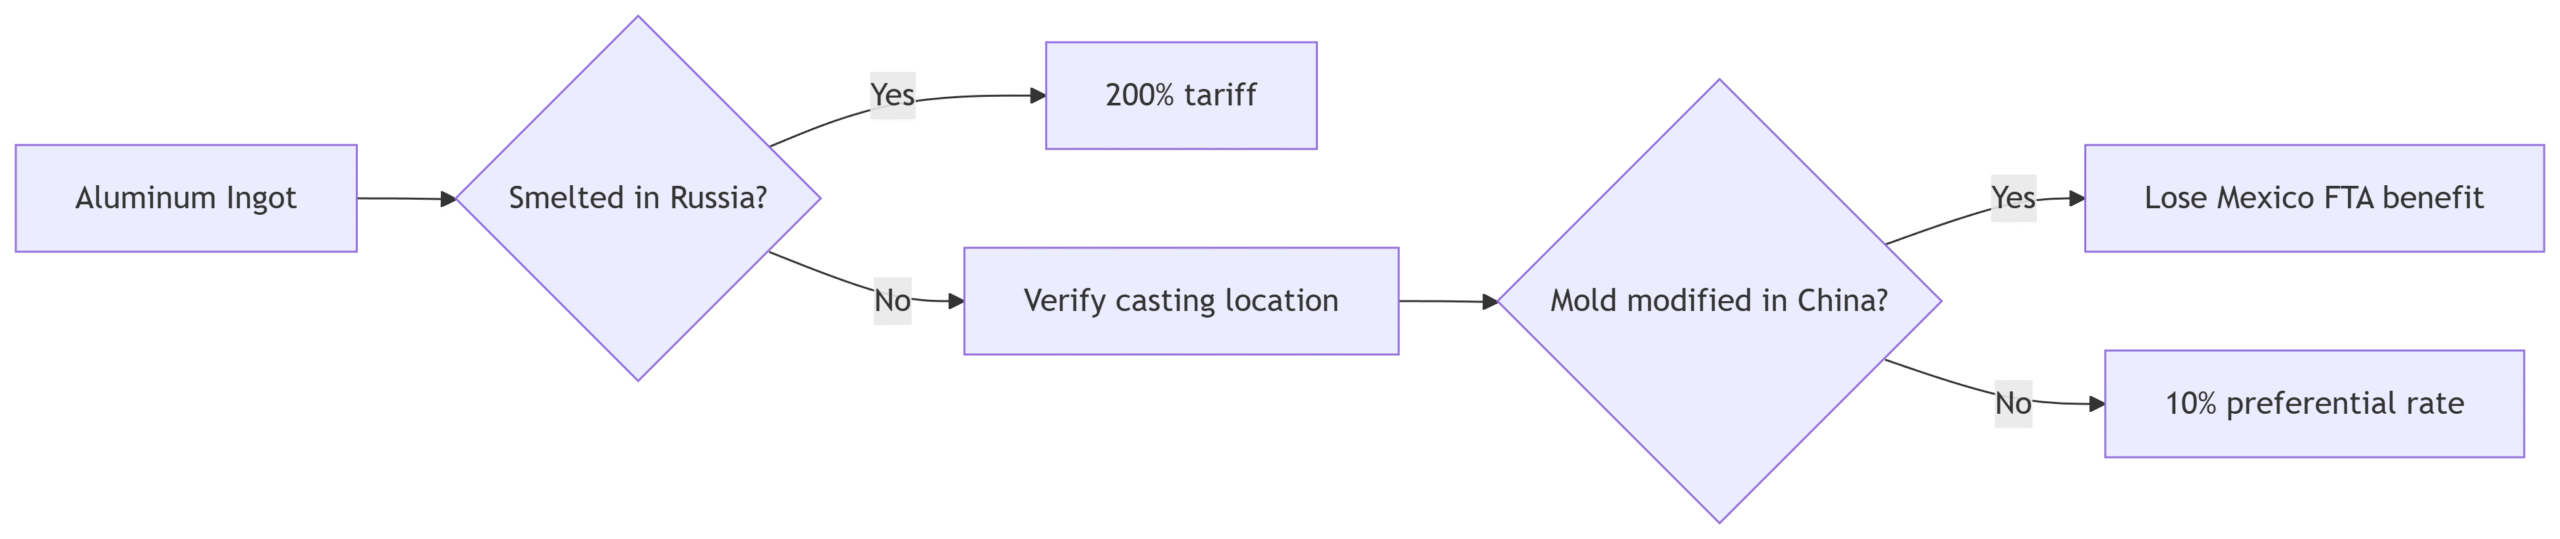
🧩 4. Rules of Origin Complexity: Flowcharts
Preferential origin rules are now make-or-break: